Original published work / Big Data & Analytics
Fast Food Chain Sustainability Study
A restaurant industry research document combining brand comparisons, sales context, demographic information and market indicators.
Business context
Turn information into a decision
Analysis is useful when a reader can connect the evidence to an action. These materials show how reporting and research support business decisions.
Charts are assembled around commercial questions rather than shown as isolated visuals. Source periods matter when interpreting the figures.
The work
Inside the original
A restaurant industry research document combining brand comparisons, sales context, demographic information and market indicators.
- Evidence and definitions
- Analysis structure
- Decision context
Read text from the original document
Extracted from the archived source, including its historical wording. Product, market and performance assertions belong to that source and are not independently verified here.
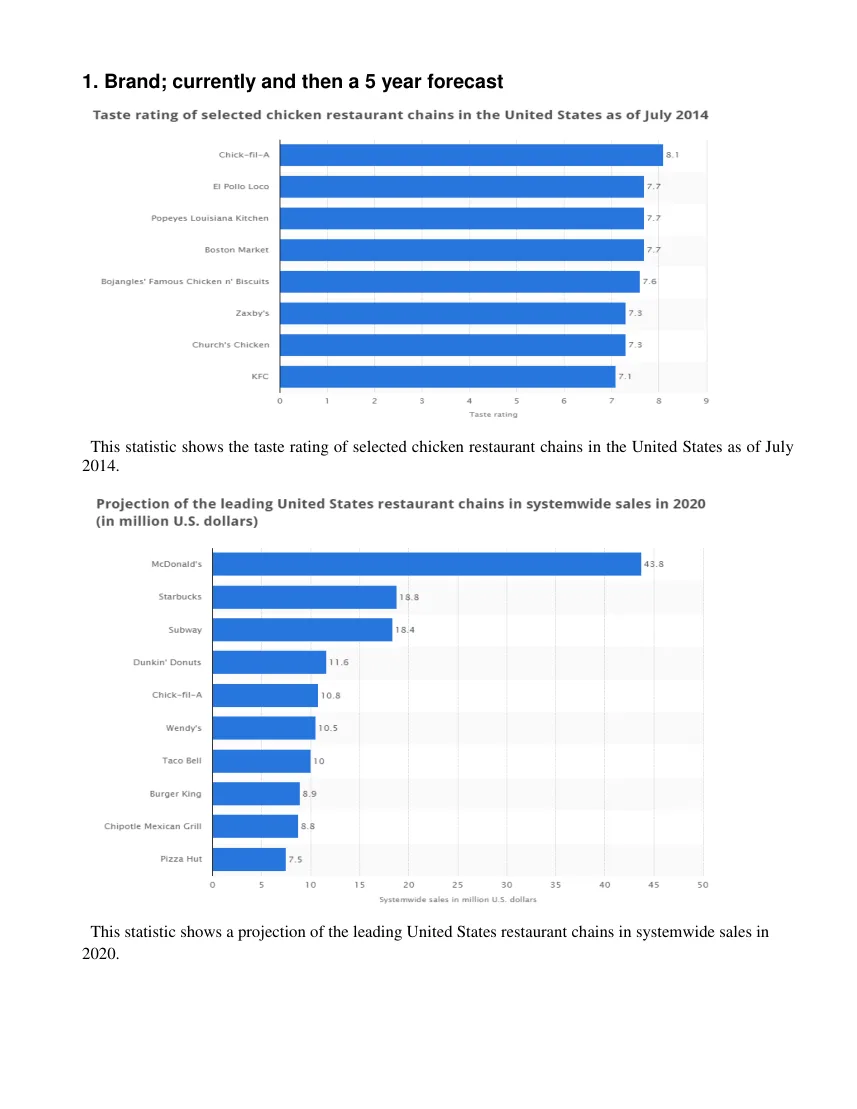
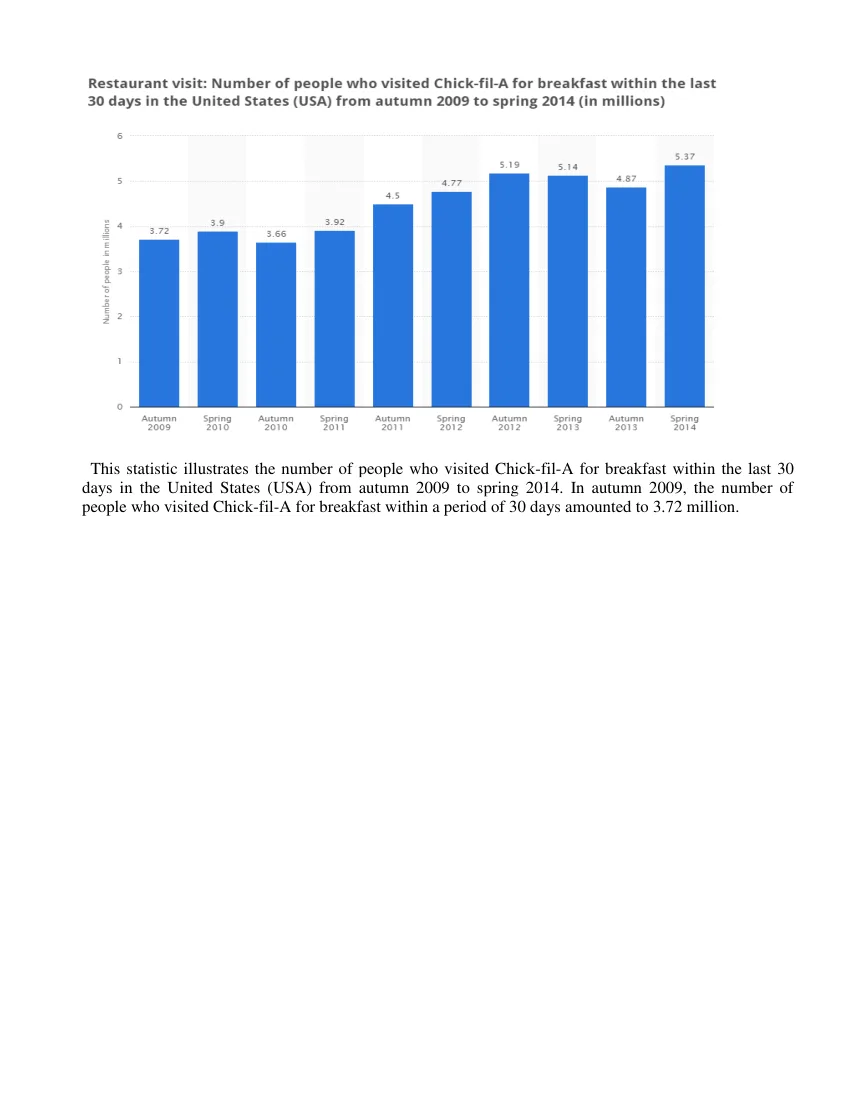
Sustainability Study 1. Brand; currently and then a 5 year forecast This statistic shows the taste rating of selected chicken restaurant chains in the United States as of July 2014. This statistic shows a projection of the leading United States restaurant chains in systemwide sales in 2020. 2. Demographics and analysis of key markets This statistic shows the average sales per unit of KFC in the United States from 2006 to 2013. In 2013, KFC's average sales per unit reached 942 thousand U.S. dollars. This statistic illustrates the number of people who visited Chick-fil-A for breakfast within the last 30 days in the United States (USA) from autumn 2009 to spring 2014. In autumn 2009, the number of people who visited Chick-fil-A for breakfast within a period of 30 days amounted to 3.72 million. 3. Locations of competitor within the entire State This statistic shows the number of units for the two competitors under study, in the three states of Florida, North Carolina, & Virginia. State CHICK FIL A Locations KFC Locations FLORIDA 114 336 NORTH CAROLINA 91 201 VIRGINIA 38 75 4. Location of…Read the complete original document
Inspect the deliverable
The original work, in context.
Open the project to explore the complete work.

Relevance to your business
When this type of work helps.
For similar work, define the business question and the data available before choosing a dashboard. Agree on event definitions, source reconciliation and the decisions a report should support.
Build on the idea
What could this look like for your business?
Tell us what you sell, who you need to reach and what is getting in the way. We can define the deliverables and the measures that fit your situation.
About this historical sample
This entry was published in the original Final Step Marketing portfolio. Titles and service classifications come from that catalog. The description summarizes the source document. Project dates, individual responsibilities and measured client outcomes are not inferred. Some entries are versions or related deliverables from the same engagement.